Study Area
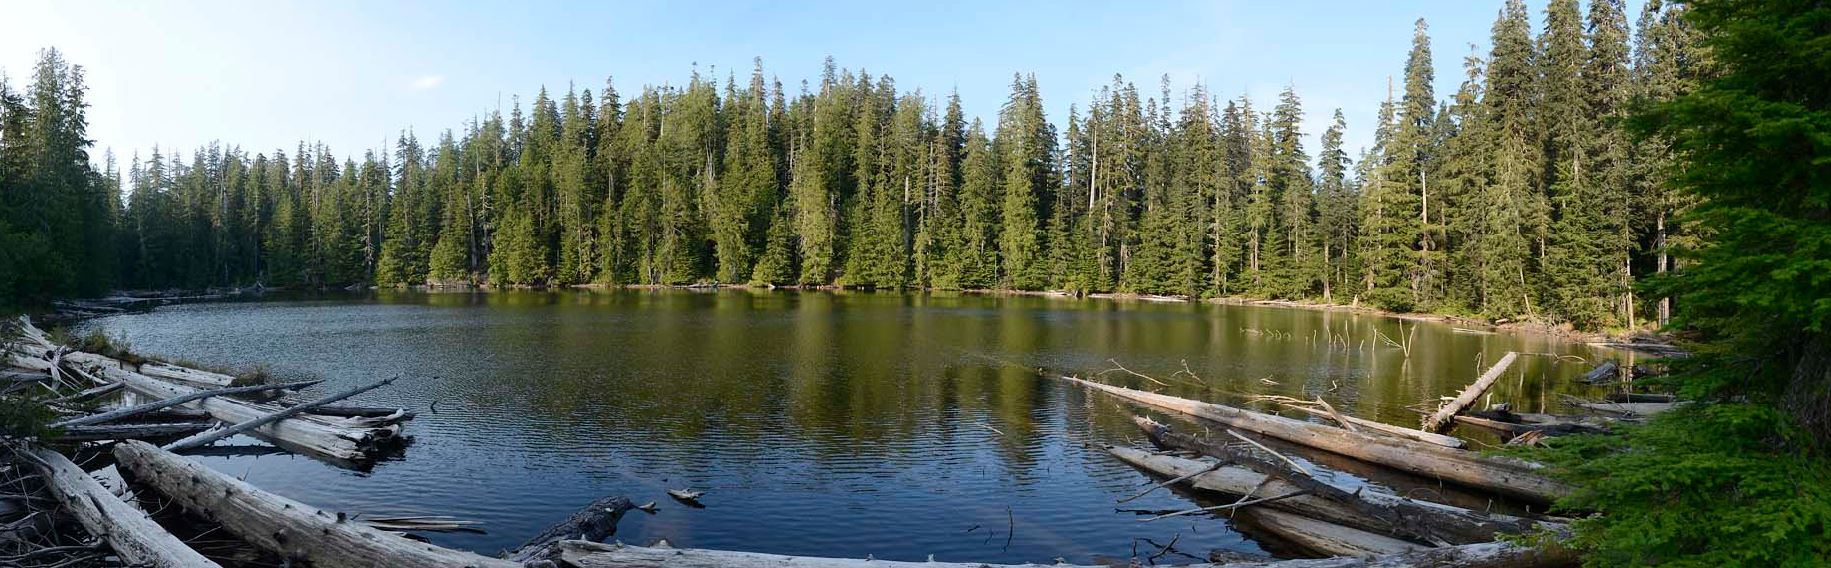
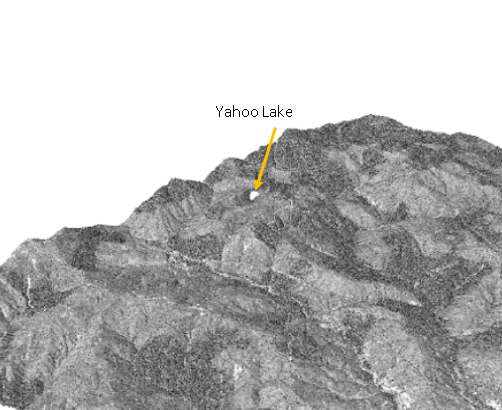
The goal of my analysis was to determine the level of ruggedness for a popular hiking trail, Yahoo Lake Trail, on the Olympic Peninsula. This area was chosen because of the high availability of high-resolution LiDAR data from the WA DNR LiDAR data portal. The study area is a popular hiking and recreation area in Jefferson County, WA. For this analysis, the Yahoo Lake Trail was analyzed using the Topographic Position Index. The Topographic Position Index (TPI) compares the elevation of each cell in a DEM to the mean elevation of a specified neighborhood around that cell (Weiss, 2001). This determines the “ruggedness” of the area, knowledge that can be helpful to hikers when determining the best route to take, and when considering if a hikes difficulty.
A model tool was created to perform this analysis. The model is based on a tool created by Tom Dilts of the University of Nevada Reno. Figure 1. shows the workflow of the model tool built using ArcMap software. Using an input of an elevation raster, the Focal Statistics tool calculates the mean cell value in raster neighborhoods. The Raster Calculator is then used to subtract the mean cell values from the original cell values. The final output is a raster with new values calculated by the tool. In order to view the data correctly, I had to symbolize the values by standard deviations then categorized into five categories; valley, lower slopes, flat slopes, upper slopes, and ridges. Positive TPI values represent locations that are higher than the average of their surroundings, as defined by the neighborhood (ridges). Negative TPI values represent locations that are lower than their surroundings (valleys). TPI values near zero are either flat areas (where the slope is near zero) or areas of constant slope (Weiss, 2001).
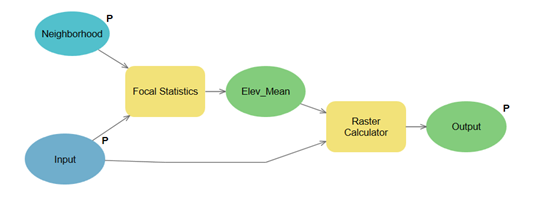
TPI model tool built in ArcMap
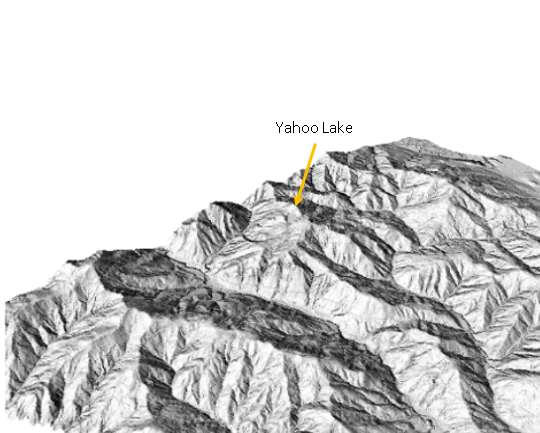
Digital Elevation Model (DEM) of study area
Digital Surface Model (DSM) of study area.
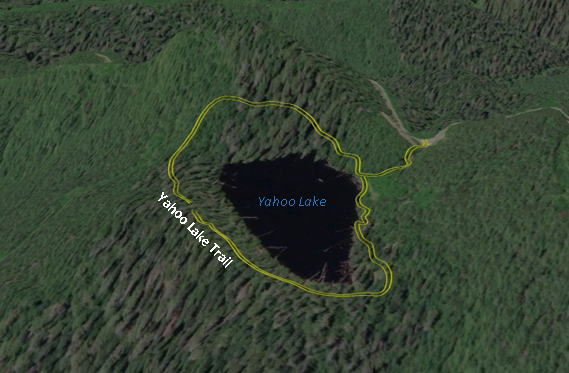
With the trail overlaid onto the study area, it is possible to see how rugged the trail will be. The TPI shows that the trail mostly follows a path that avoids most upper slopes and ridges. In Figures 4 and 5, the hiking trail is shown in a slope raster and the TPI raster. When comparing the two images, you can see that the TPI is consistent with the slope in that the lower slope (flatter) areas are also shown as less rugged areas in the TPI. Using the example of Yahoo Lake Trail, a hiker could see that the trail has low ruggedness and can assume the hike will be less difficult. This is just one of the many uses of a Topographical Position Index.
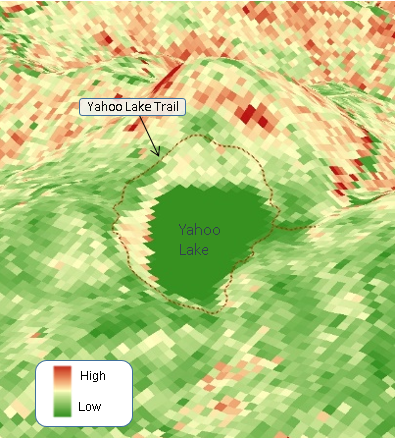
Slope calculation results
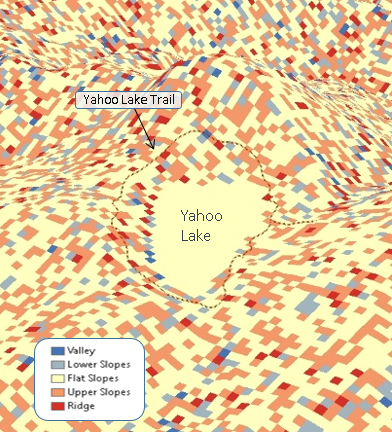
Topographic Position Index (TPI) results
Andrew D. Weiss. (2001). Topographic Position and Landforms Analysis. The Nature Conservancy. Accessed April 2019.
Tom Dilts. (2016).Topography Tools for ArcGIS 10.3 and earlier. University of Nevada Reno. Accessed May 2019